TLKM Date : 25-10-12
Financial Performance (in billion Rp)
www.investdata.net
2012 2011| 2010|
25-10-12 ....Q3 ....Q2 ....Q1|....Q4 ....Q3 ....Q2 ....Q1|....Q4|
---------- ------ ------ ------ ====== ------ ------ ------ ====== ------
Sales 57.413 36.720 17.796 71.253 53.050 34.371 16.706 68.629
COGS 38.110 24.801 11.756 49.970 36.654 23.322 11.386 46.138
Gross Marg 19.303 11.919 6.040 21.283 16.396 11.049 5.320 22.491
GM (%) 33 32 33 29 30 32 31 32
Opr Profit 19.303 12.298 6.071|21.948 16.567 11.317 5.135|22.491
OP (%) 33 33 34 30 31 32 30 32
Net Profit 10.001 6.428 3.322|10.965 8.385 5.940 2.828|11.537
NP (%) 17 17 18 15 15 17 16 16
---------- ------ ------ ------ ====== ------ ------ ------ ====== ------
Stk Price 9.650 9.450 8.150 7.000| 7.050 7.600 7.350 7.200| 7.950
Book Value 2.417 2.251 2.464| 2.414 2.334 2.251 2.401| 2.258
PBV 3,99 3,91 3,62 2,84| 2,92 3,25 3,26 3,00| 3,52
DER 1,16 1,24 1,11| 1,17 1,16 1,26 1,13| 1,25
---------- ------ ------ ------ ====== ------ ------ ------ ====== ------
ROE (%) 27 28 26| 23 24 26 23| 25
ROE (Qtr) 29 27 26 21 21 28 23 23
ROA (%) 12 12 12| 10 11 11 11| 11
Opr prof/share 957 610 301| 1.115 841 576 261| 1.143
EPS 496 318 164| 557 426 302 143| 586
EPS (Qtr) 177 154 164| 131 124 158 143| 131
EPS (Annu) 661 637 659| 557 568 604 575| 586
PER 14,59 14,29 12,78 10,62| 12,65 13,38 12,15 12,52| 13,55
PER (Qtr) 13,61 13,33 13,22 10,62| 13,44 15,29 11,59 12,52| 15,17
---------- ------ ------ ------ ====== ------ ------ ------ ====== ------
COP (year) 7,56 7,40 6,68 5,81 6,32 6,77 6,38 6,89 6,95
CLOP(year) 9,76 9,60 8,96 8,07 8,85 9,19 8,83 9,50 9,41
CLOP(Qtr) 8,97 8,82 8,85 8,07 9,03 9,67 8,09 9,50 9,99
---------- ------ ------ ------ ====== ------ ------ ------ ====== ------
Sales Growth(%) 8 6 6 3
Op.Prof Growth(%) 16 8 18 -2
Net.Prof/EPS Grow 19 8 17 -4
PEG (<1 ----------="----------" ------="------" -2="-2" 0="0" 105.404101.536104.624="105.404101.536104.624" 11.386="11.386" 11.756="11.756" 11.936="11.936" 12.023="12.023" 13.045="13.045" 13.309="13.309" 13.316="13.316" 13.332="13.332" 13="13" 14="14" 16.706="16.706" 16="16" 17.320="17.320" 17.665="17.665" 17.796="17.796" 17="17" 18.202="18.202" 18.679="18.679" 18.924="18.924" 18="18" 19.637="19.637" 19.669="19.669" 19.679="19.679" 1="1" 2.445="2.445" 2.576="2.576" 2.579="2.579" 2.828="2.828" 20.160="20.160" 20.693="20.693" 26="26" 28="28" 29="29" 3.106="3.106" 3.112="3.112" 3.322="3.322" 3.573="3.573" 30="30" 31="31" 32="32" 33="33" 34="34" 35="35" 4.886="4.886" 44.221="44.221" 45.385="45.385" 45.951="45.951" 47.239="47.239" 48.728="48.728" 49.683="49.683" 5.135="5.135" 5.250="5.250" 5.296="5.296" 5.320="5.320" 5.347="5.347" 5.381="5.381" 5.729="5.729" 5.879="5.879" 53.445="53.445" 53.521="53.521" 54.941="54.941" 55.612="55.612" 56.151="56.151" 56.676="56.676" 6.040="6.040" 6.071="6.071" 6.182="6.182" 6.227="6.227" 7.005="7.005" 7.384="7.384" 99.473="99.473" 99.834100.685="99.834100.685" and="and" asset="asset" capitalis.194.543190.511164.303141.120="capitalis.194.543190.511164.303141.120" cogs="cogs" equity="equity" error="error" gm="gm" gross="gross" liability="liability" marg="marg" mil="mil" net.pr="net.pr" np="np" omission="omission" op.pr="op.pr" op="op" pre="pre" sales="sales" see="see" share="share" tr="tr">
- http://www.investdata.net/QQITLKM.TXT
Chart TLKM udah dikirim 2 bulan lalu ....
- http://www.obrolanbandar.com/plltlkm120819.png
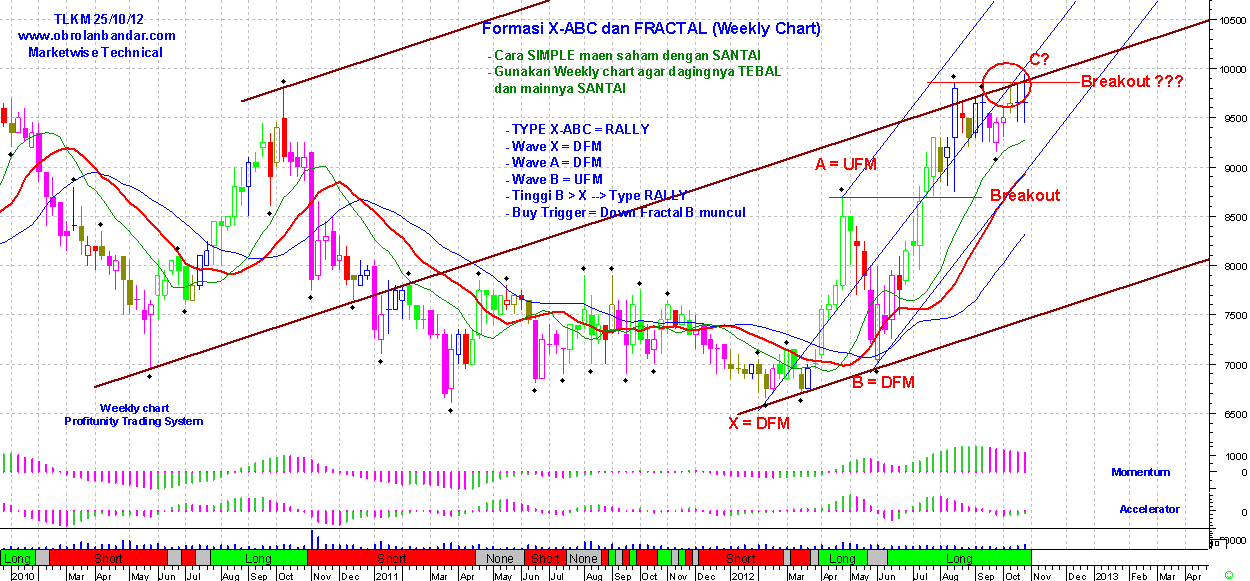
TLKM trading lagi kalo bisa breakout
Ini level Breakoutnya: (persis pada tARGET HIGHER LEVEL X-ABC)...
Kalo engga bisa tembus, Target Wave C sudah tercapai ...
 - http://www.obrolanbandar.com/plltlkm121025.png
Sunday, October 28, 2012
TLKM: Q3/2012 Result
Subscribe to:
Post Comments (Atom)
No comments:
Post a Comment